|
Figure 1 Jun 29, 2013: People wear face masks on Orchard Road in Singapore (fromAFP) |
In our last post we have been discussing about the last Sumatra haze spell in South Peninsular Malaysia and in Simgapore, based on
the official readings released by both Malaysia DOE and Singapore NEA.
We explained that air
pollution indexes and sub-indexes in Malaysia or Singapore were established
following rules very similar to the US Air Quality Index including 5 only among the US AQI pollutants
(PM10, O3, CO, SO2 & NO2), but without the 6th PM2.5 pollutant used also in US AQI and EU CAQI
indexes.
In Malaysia, it seems that
PM2.5 is some time measured but not published, while in Singapore PM2.5 is measured and
published along with the PSI index, but not incorporated as a sub-index before air
quality index computing.
Air Quality Index compared computations from EU, US, Malaysia and Singapore
In my post date 14 July,
2013, I have explained how is computed the US AQI Index. You may find the AQI and its sub-indexes definition in « Technical Assistance document for the Reporting of Daily Air Quality the AirQuality Index (AQI)”.
In UE the Common Air Quality
Index (CAQI) is an European Development with two indexes
« background » and « road-side ». We have selected as a
comparison’s reference the background CAQI and its sub-indexes see CAQI from EU Common Air Quality Index European Development.
Because CAQI is
aiming mostly light polluted areas, the EU pollutant scale is much more limited than
in US AQI and as a consequence the grid values are much higher (for instance
CAQI=100 with PM10=100 when US AQI= 100 with PM10=154). So we have adjusted and decreased the CAQI grid in order to meet US
AQI at least for PM10.
For Malaysia API: see “API a guide for air pollutant index in Malaysia” and for Singapore PSI index: see “Computation of the PollutantStandards Index (PSI) “PDF document.
The following five Figures 2-6
are giving, for any value of the measured pollutant concentration located
inside two "turning points", the successive linear relationships to
calculate the value of the index with a "grid" common understanding
between all indexes and sub-indexes.
Each broken line describes pollutant action on
human health, each turning point corresponding to the crossing of a threshold
effect on health. The greater the index the more unheathy it is with grid<100 corresponding to good or moderate air quality.
Figure 2 shows a good relationship
between all the various sub-indexes for PM10
sub-indexes; and a slight divergence between EU and US for PM2.5
sub-indexes.
 |
Figure 2: Comparison of air quality sub-indexes for particulate matter pollutants (PM10 & PM2.5), over EU, US and API/PSI South Asia sub-indexes |
 |
Figure 3 : Comparison of air quality sub-indexes for carbon monoxide (CO) pollutant, over EU, US and API/PSI South Asia sub-indexes |
Figures 4, 5 & 6 are showing more divergences between all countries for O3, SO2 and NO2 pollutant sub-indexes.
 | ||||
Figure 4 : Comparison of air quality sub-indexes for Ozone pollutant (O3), over EU, US and API/PSI South Asia sub-indexes.
The importance of PM2.5 pollutant to assess the air quality(See PM2.5 fact from US EPA) |


Particles less than 10 µm in diameter (PM10) pose a health concern because they can be inhaled, accumulated in the lungs and damage the respiratory system.
Particles less than 2.5 µm in
diameter (PM2.5) -referred to as "fine" particulate matter- are believed
to pose the greatest health risks. Why? Because of their small size (around 1/30th the width of a human hair), fine particles can be trapped deeply into the
lung cells producing various health hazards: asthmas, infection, cancer etc..
Sources of fine particles
include ashes and residues from all types of combustion activities (wood
burning, power plants, motor vehicles etc.) and certain industrial processes.
Particles with diameters
between 2.5 and 10 µm are referred to as "coarse" particulate matter.
Sources of coarse particles include crushing or grinding operations, and dust
from paved or unpaved roads.
Other particles may be formed
in the air from the chemical change of gases. They are indirectly formed when
gases from burning fuels react with sunlight and water vapor. These can result
from fuel combustion in motor vehicles, at power plants, and in other
industrial processes.
Roughly one out of three persons is at a higher risk of experiencng PM2.5 related health effects, mostly children with their bodies still developing and the elderly due to their lower resistance.
People of all age active outdoors during physical activities are at increased risk because with increased air intake PM2.5 penetrate deeper into the more vulnerable part of the lungs.
Due to their deadly effect on human health it is urgent - as for EU and US- to include PM2.5 in the sub-index standards in Southeast Asia API/PSI readings
As we know that most API/PSI readings are mostly derived from the high value of PM10 sub-index, they have reciprocally the same "turning points" and it is easy to derive the value of PM10 from the API/PSI readings by using the PSI/API sub-index reciprocal linear relationship.
The following Figure 7 gives both values of PM10 and PM2.5 concentrations respectively computed or read for South Singapore PSI (See: PSIHistorical readings).
We can see that PM10 is mostly composed of 75-80% of PM2.5. This means that the coarse particulate are only 20-25% and - as we can see on Figure 2 above- that the value of the PM2.5 sub-index is much higher than the value of the PM10 sub-index.
We can see that PM10 is mostly composed of 75-80% of PM2.5. This means that the coarse particulate are only 20-25% and - as we can see on Figure 2 above- that the value of the PM2.5 sub-index is much higher than the value of the PM10 sub-index.
 |
Figure 7 : South Singapore PM10 & PM2.5 concentrations computed from PSI or read |
The following Figure 8 shows
that the “true” PSI - including the PM2.5 sub-index -is around 50-80% higher
than the official reading.
 |
Figure 8 :
South Singapore official PSI without PM2.5 and PSI including PM2.5
sub-index
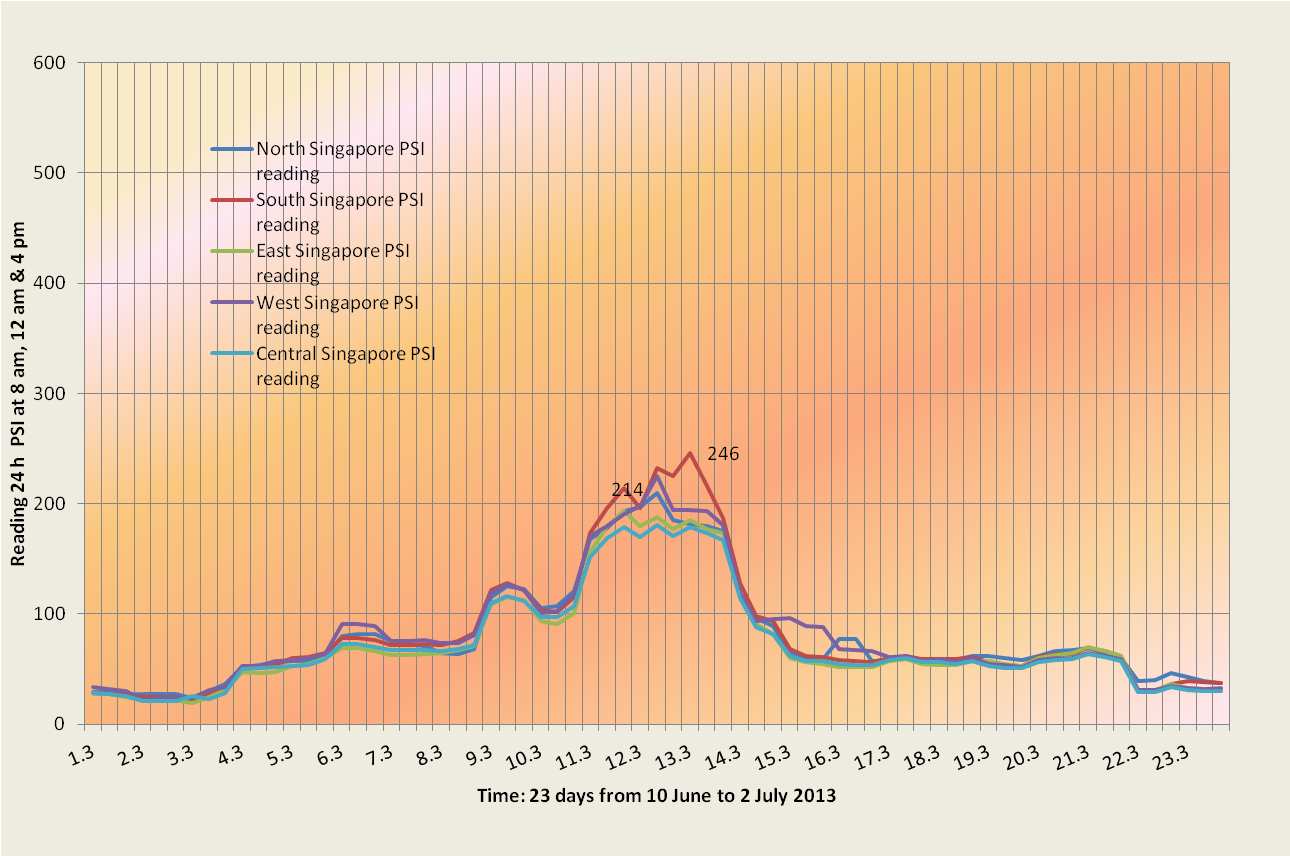
On 20 -21 June 2013, the “official” PSI as recorded by Singapore NEA was only 246 but the "true value" of
the Pollutant Standards Index incorporating the more dangerous PM2.5 pollution was around 344.
However, it
appears that in its communication with the media, Singapore NEA has already
made the change, according to an article in the
Straits Times referring that Singapore Pollutant Standards Index "soared to 321 on 19 June
the worst reading in its history, the previous being 226 in 1997".
If we keep in
mind that at the same time in Malaysia the highest readings - 746 in Muar, 487
in Ipoh and 443 in Melaka- were issued without any correction for PM2.5, the
general picture on the Southeast Asia pollution was reallly difficult to assess!
So in order to inform as fairly as possible the population on Air Pollution health hazards, there is a urgent need to clarify this issue by incorporation-as in EU and US- the PM2.5 fine particulate matter
sub-indexes into API / PSI air quality indexes used in Southeast Asia.
|